Usage as a terminal UI
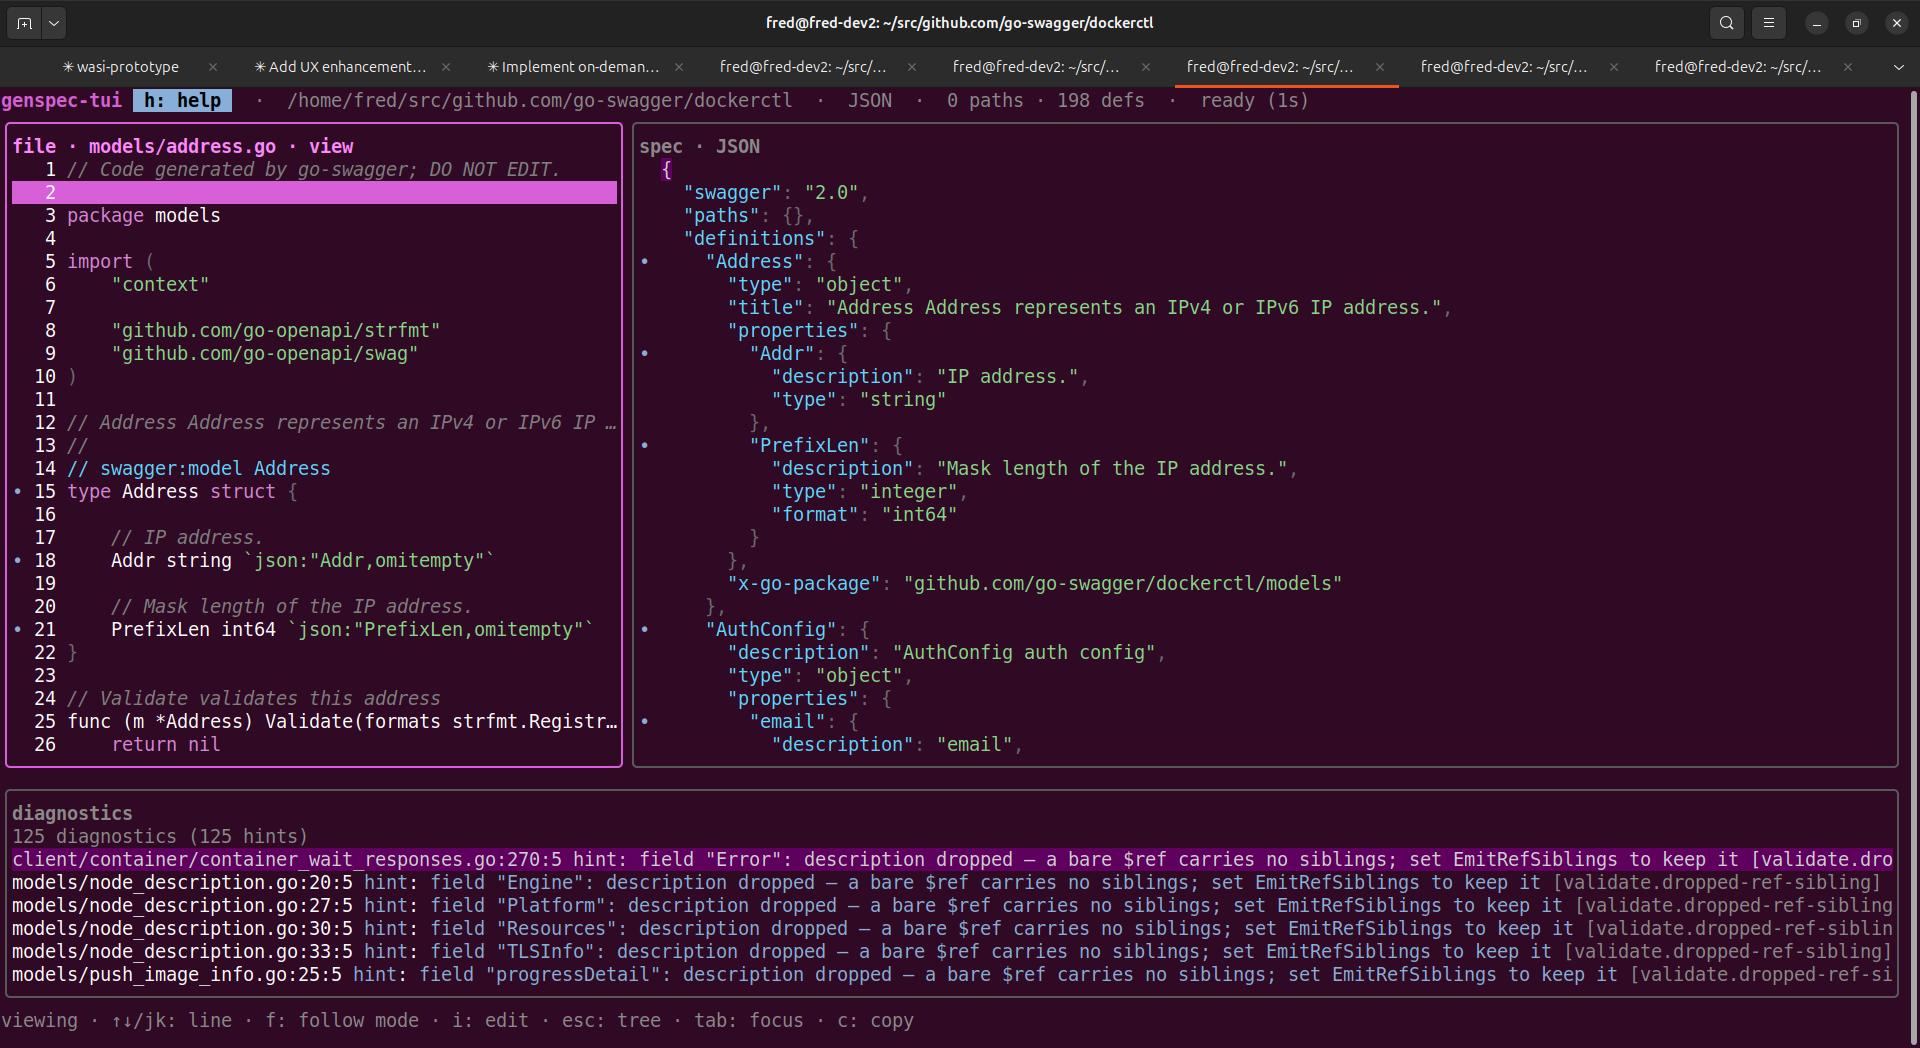
genspec-tui is an interactive terminal front-end for codescan.
It puts the Go source on the left, the Swagger document that source produces on the right, and the scanner’s diagnostics underneath — all regenerated every time you save.
Its reason to exist is that loop: change an annotation, save, see the spec change.
Predicting what an annotation will produce is the slow part of writing one, and reading a golden file after a build is a poor substitute for watching the node appear.
Beyond the loop, it links the two sides together. You can ask “which Go declaration produced this node?” or “what did this field turn into?” and get an answer by position — not by matching names by eye.
Note
The TUI is a separate Go module inside the codescan repository, so bubbletea and its dependency tree never reach the library — installing it pulls none of that into your own project. Why the commands are split that way is in The commands.
Install and run
The selected packages are a positional argument, resolved against -workdir; naming none scans ./....
-packages, taking one comma-separated list, is the older spelling and still works
The TUI registers the same flags as the other commands — one per field of
codescan.Options — and reads the same
.codescan.yaml, so a session starts where
your build leaves off. The flags decide the first scan; almost all of them are
also live toggles, below.
The ones worth knowing at the point of starting a session:
| Flag | Default | Meaning |
|---|---|---|
-workdir | . | module directory the scan runs in (WorkDir) |
-scan-models | true | also emit definitions for swagger:model types |
-build-tags | — | comma-separated build tags to apply while loading |
-include / -exclude | — | patterns selecting which packages are scanned |
-include-tags / -exclude-tags | — | swagger tags selecting which operations are emitted |
-name-from-tags | json | ordered struct tags a field’s name derives from, e.g. form,json for gin. Pass -name-from-tags= (empty) to use the Go field name |
-name-concat-budget | 0.65 | readability cutoff when deconflicting colliding definition names |
Note that -scan-models defaults to on here, where the library’s
ScanModels defaults to off. A spec you are browsing in order to see what your
types became has little to show without them.
A second group settles what gets built, and how it is loaded — the environment
go list would read, plus codescan’s own loader:
| Flag | Default | Meaning |
|---|---|---|
-goos / -goarch | this machine’s | the platform the scanned code is built for, so build-tagged files are selected the way that platform selects them |
-goflags | — | default go command flags, as GOFLAGS — -build-tags wins over a -tags given here |
-gowork | search upwards | workspace selection, as GOWORK: off to ignore a go.work, or the path to one |
-goexperiment | — | toolchain experiments, as GOEXPERIMENT |
-loader | auto | auto runs go list, as every native build does, and picks own only where no subprocess can be started; go always runs go list; own always uses codescan’s own loader, which needs no toolchain (experimental) |
-stub-stdlib | false | synthesize the standard library instead of reading GOROOT (needs -loader=own) |
-compiled-dependencies | false | take dependency types from the compiler’s export data instead of reading every dependency from source (needs -loader=go). Worth having here more than anywhere: a session rescans on every save, so the build cache is warm after the first one |
Everything the flags set is also a live toggle. Press o for the options
popup, space to flip a row, Esc to apply — the spec re-renders on close, which
makes the popup the fastest way to find out what a knob such as EmitRefSiblings
actually changes. Rows that only bite in combination say so: PruneUnusedModels
reads (needs ScanModels) until that one is on.
Being in both places is the point: you can start a session one way and change your
mind without restarting. The one option with no route in at all is InputSpec
(overlay mode).
Scanning: the edit-save-see loop
The left pane starts as the source tree; Enter opens a file into the viewer,
which is read-only and navigable. i turns it into an editor, Ctrl-S saves, a
file watcher notices the write, and the spec re-renders. Editing outside the TUI
works just as well — disk is the source of truth, and F5 re-reads the open file
(asking first, if you have unsaved edits to lose).
A rescan keeps you where you were. The spec cursor is restored to the same node, not the same line number, so a definition that appears above what you are reading does not slide you somewhere else. If the node is gone — you deleted the type — the cursor falls back to its nearest surviving ancestor.
Both panes are syntax-highlighted by the same palette, and in the source viewer a comment gets three classes rather than one, because in a spec generator a comment is not uniformly commentary:
| Looks like | Reads as | Why |
|---|---|---|
// swagger:model order | a spec key | the annotation declares the thing; it is the input that produced the pane opposite |
// required: true | a keyword | grammar the parser acts on, in the class Go’s own type and func get |
// the id of the order | dimmed prose | freeform description |
What lights up as a keyword comes from the parser’s own table, so aliases
(min → minimum) and letter case are free — and what is highlighted is what
the parser will actually act on.
Tracking: from a spec node back to the code
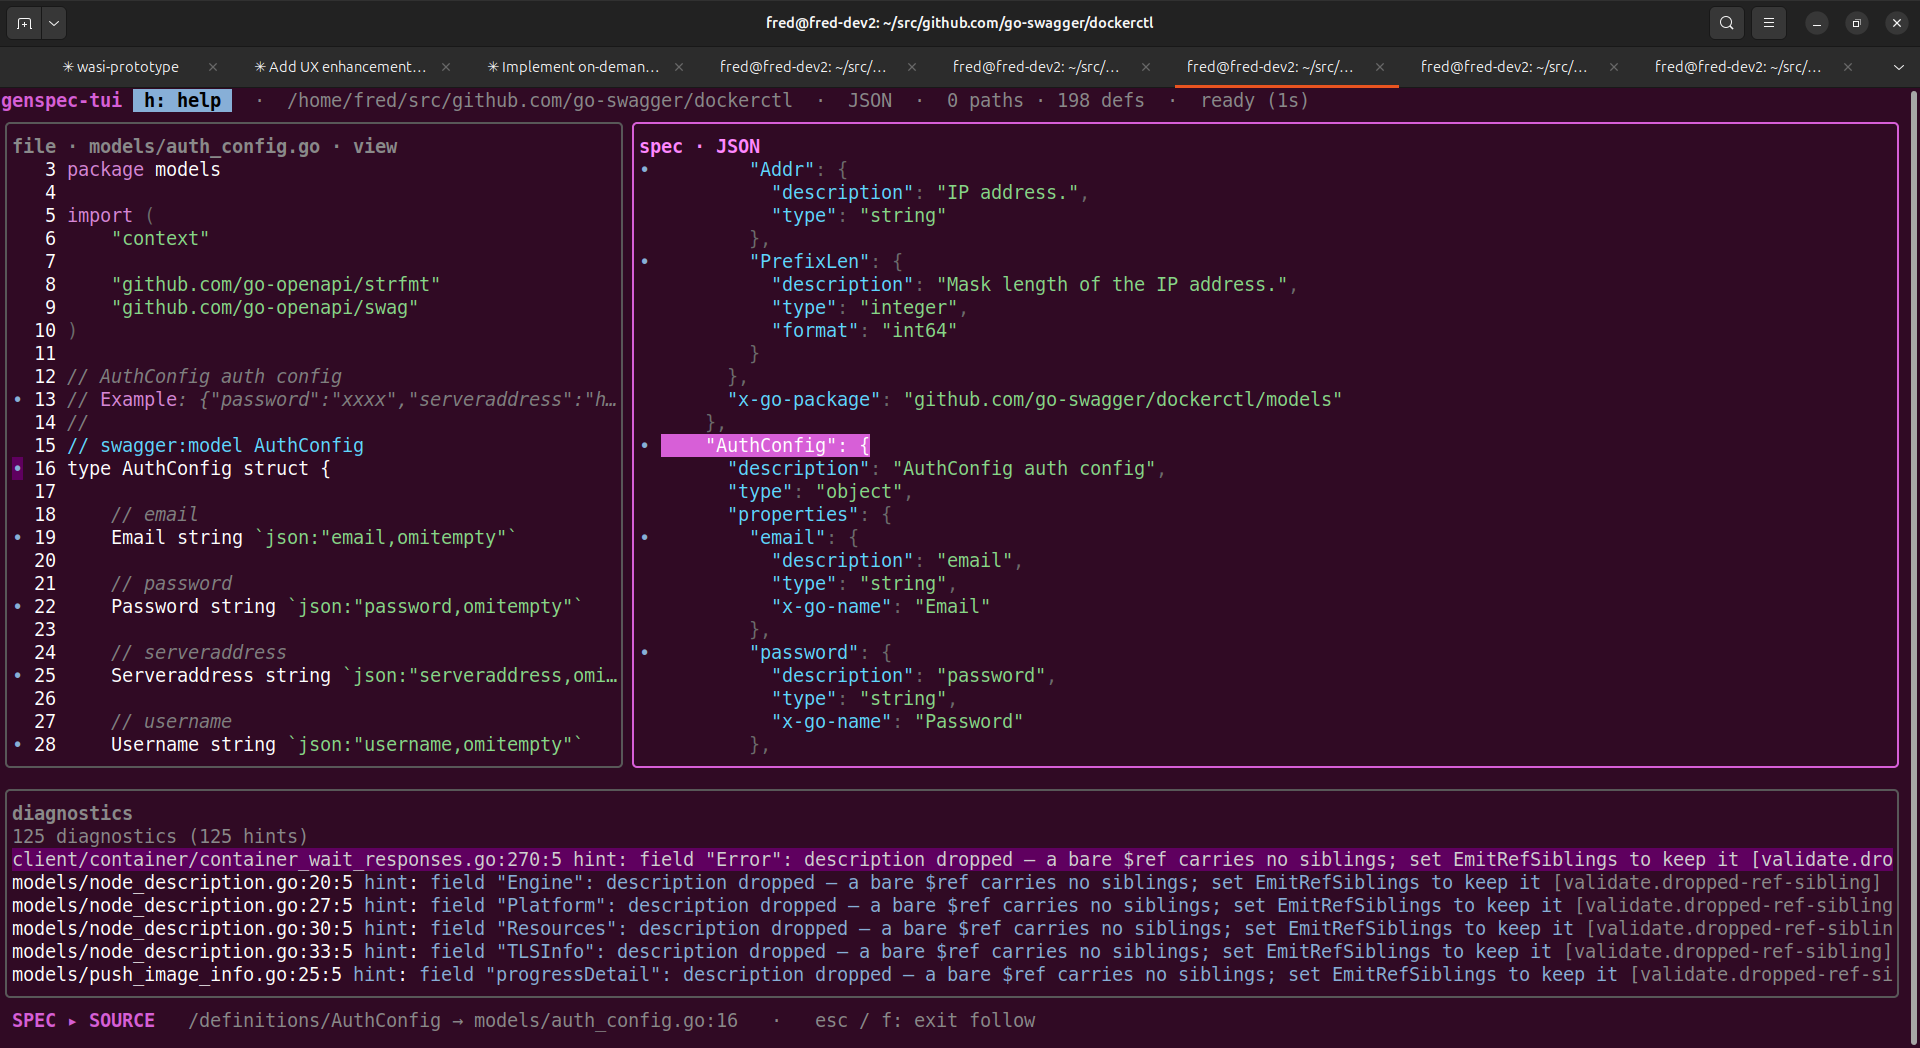
f turns on a persistent link between panes. The pane you pressed it in is the
driver and keeps focus; the others mirror it on every cursor move,
centring and highlighting the linked line. A SPEC ▸ SOURCE badge names the
direction and the target it resolved to.
It works in three directions — spec → source, source → spec, and a diagnostic to
both. Esc, a second f, changing focus, or starting to edit all leave it.
Two indexes, rebuilt on every render, meet at a JSON pointer: one maps each
rendered spec line to the pointer of the node on it, the other maps pointers back
to Go source positions through codescan’s OnProvenance callback. That is why
the answer is exact rather than a name match.
The gutter marks which lines actually lead somewhere, so you can see what is navigable without probing for it:
| Marker | In the spec pane | In the source viewer |
|---|---|---|
• | this node has a source position of its own | this line produced a spec node |
→ | a followable $ref; Enter goes to its definition | — |
Only exact anchors are marked. Nearly every line resolves to something through its nearest anchored ancestor, so marking those would dot the whole document and tell you nothing.
F3 steps through the places the node under the cursor is referenced, wrapping;
shift+F3 goes back; Enter follows a $ref to its definition.
Diagnostics: what the scanner made of your annotations
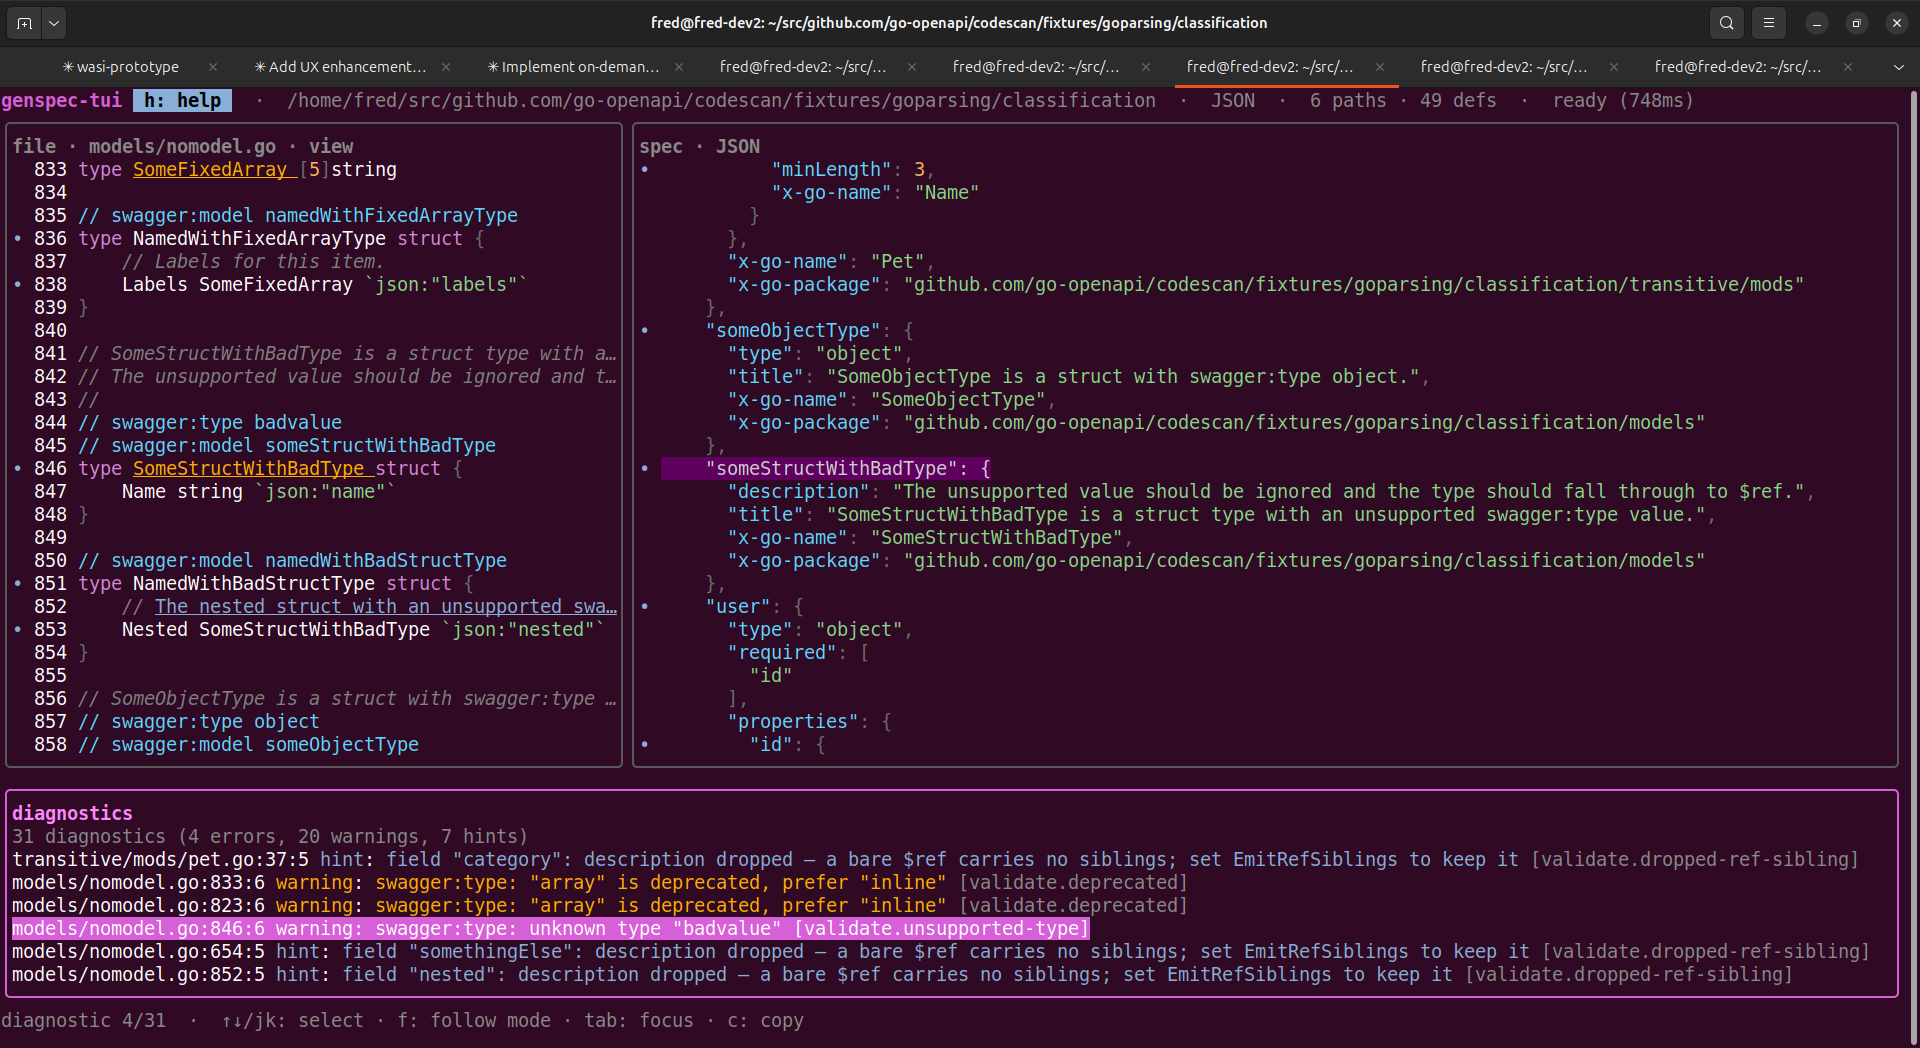
Whether your annotations were understood is a different question from whether
the document they produced is well formed, and the pane at the bottom answers
the first one. Under a one-line severity tally it lists everything the scan
observed, in source order, each row carrying its severity’s colour so the pane can
be read for red at a glance. Enter jumps to the source line a finding names and focuses
it; f makes the selection drive both other panes at once.
Findings are also drawn at the site: the token a diagnostic names is underlined in the severity’s colour, in the source viewer itself. The pane tells you what and where; the underline tells you which token, without leaving the line you are reading.
Marks are re-derived on every rescan, so they never outlive the finding that produced them.
Validating: whether the document is legal Swagger 2.0
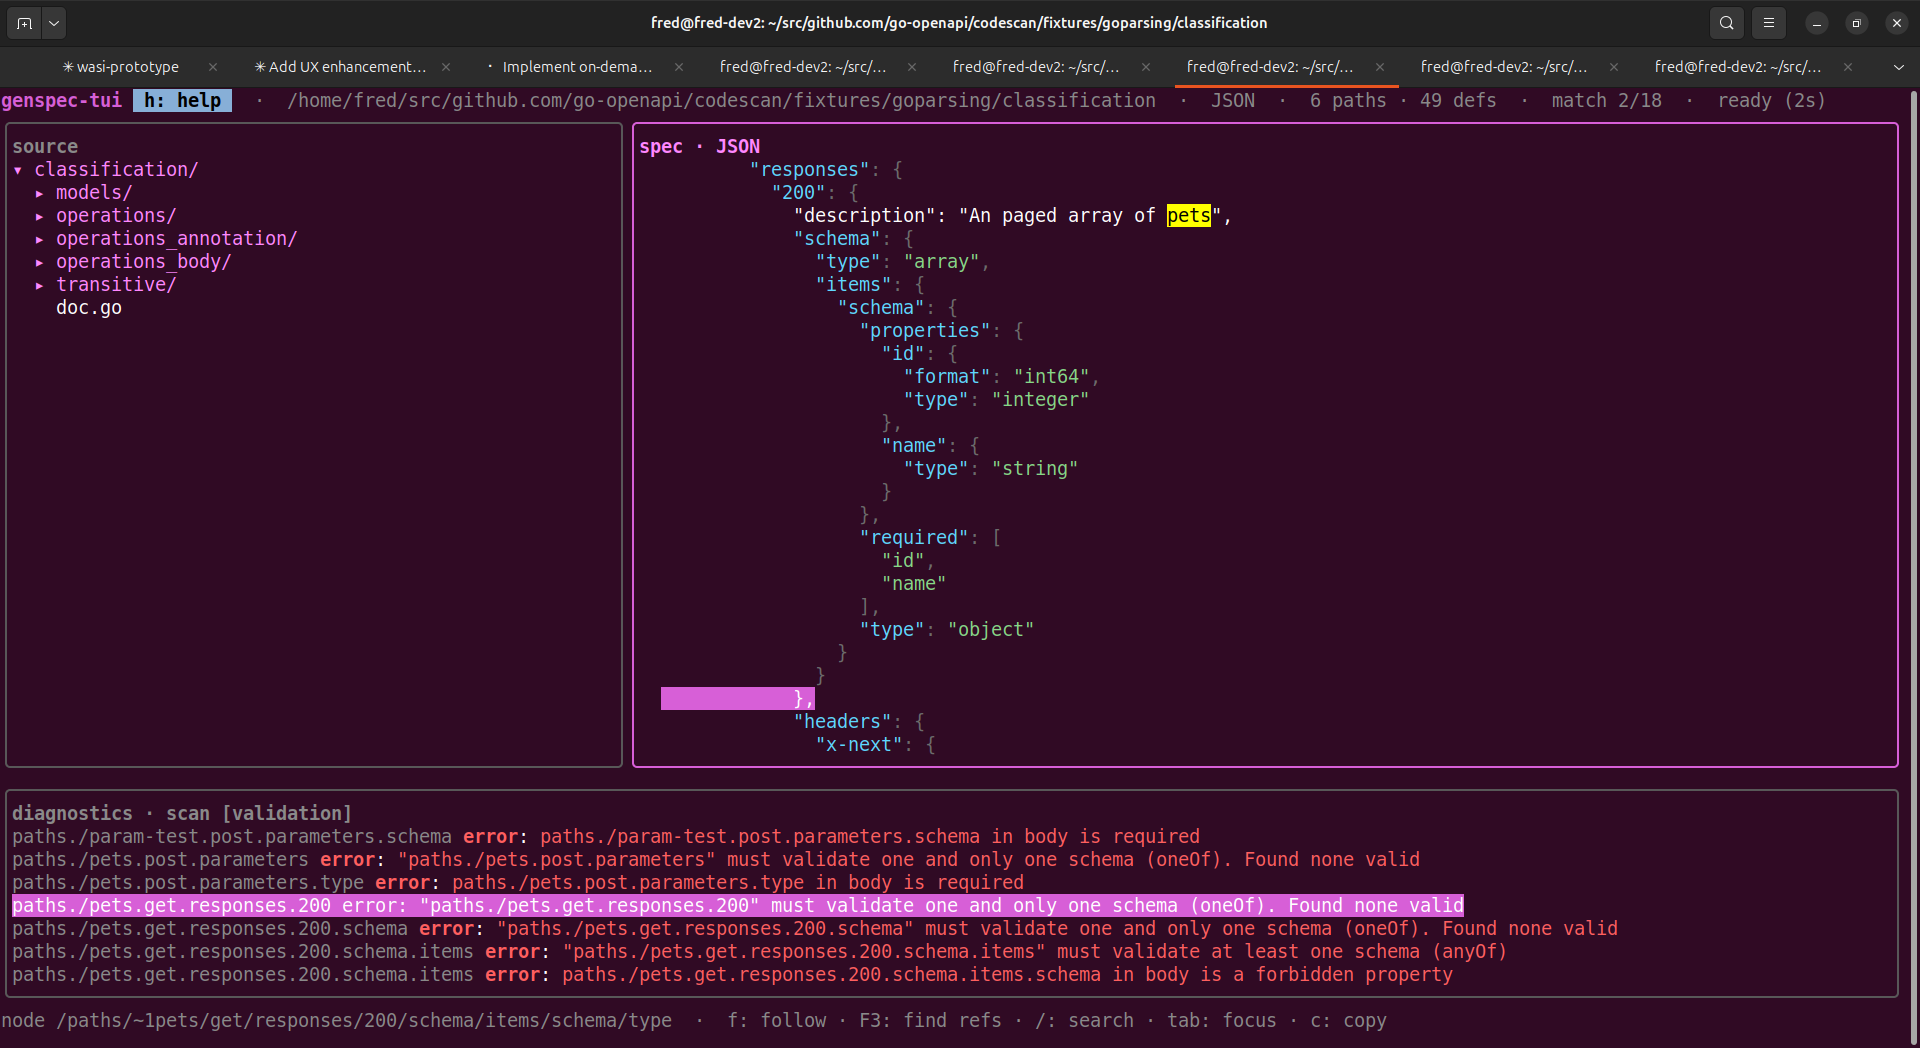
v runs the generated document through
go-openapi/validate and lists what it
finds in a validation tab of the diagnostics pane. V switches between that
tab and the scan’s own findings.
This is the second of the two questions above, and answering both is why they are tabs rather than one list: a scan can be perfectly clean and still produce something a consumer rejects.
They also track different things. A scan diagnostic carries a source position, so
it drives the source pane. A validation finding carries only a JSON pointer, so
Enter and f there drive the spec pane and nothing else.
The tab exists only once you have pressed v, and a rescan retires it: those
findings judged a document that has just been replaced, and a list of complaints
about a spec that no longer exists invites navigating to nodes that may have
moved or gone. Press v again.
Where a finding lands
A finding carries the JSON pointer the validator recorded as it walked, so
navigation is exact. Indexed paths included —
/paths/~1pets/get/parameters/0/type lands on that parameter, not on the list —
and so are faults reached through a $ref, which are reported against the shared
definition that actually holds them.
A finding about something the document lacks is reported on the value that
should hold it: a response missing its description lands on the response, and a
document missing its info block lands on the document, which Enter takes you
to the top of.
What a scan cost: m
m opens a card describing the run that just finished — how long it took, what
it allocated, what it left live, and how much the process holds from the OS.
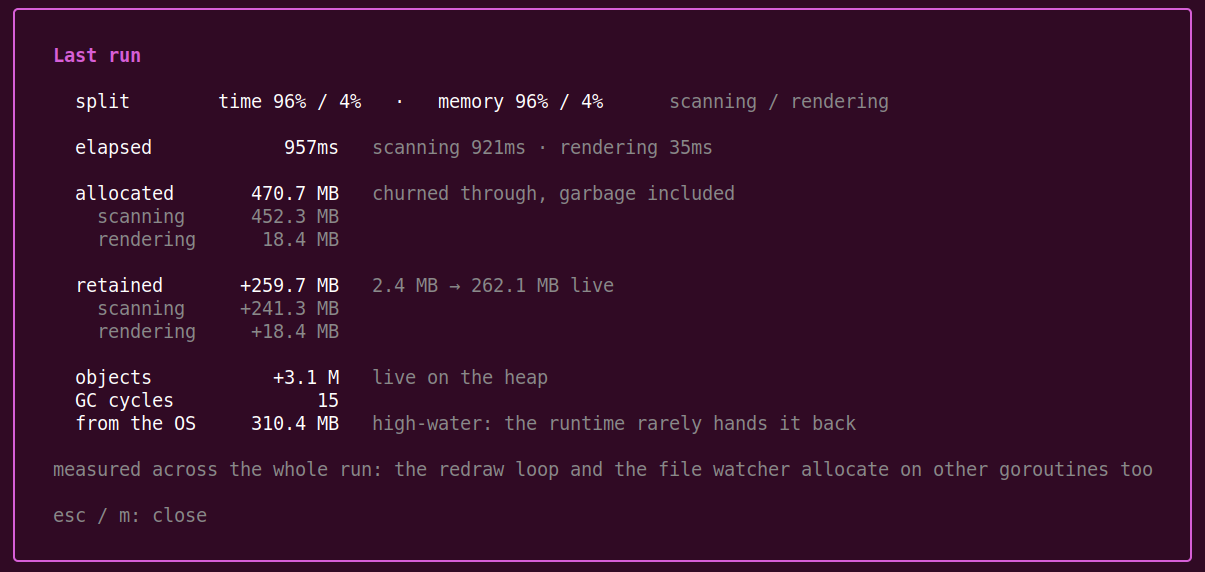
Time and memory are split between scanning and rendering the document,
and recapped as ratios on the split line, because the question a reader
arrives with is usually which phase is this? The two can disagree sharply,
which is why both are there.
Allocated counts everything the run churned through, garbage included; retained counts what it left behind. A scan that allocates half a gigabyte and retains a few megabytes is not the same problem as one that keeps what it takes, and one number could not tell you which you have.
Two things the card says about itself, worth repeating: the window is process-wide, so the redraw loop and the file watcher are in the figures; and a rescan holds two documents at once, so the retained figure reads high by about one. That is arithmetic, not a leak.
A scalar cannot say who spent it, which is what -profile is for. Start the
session with it and each scan is profiled as well as timed, so the card also
reports where the CPU went and what allocated it, by function and per phase:
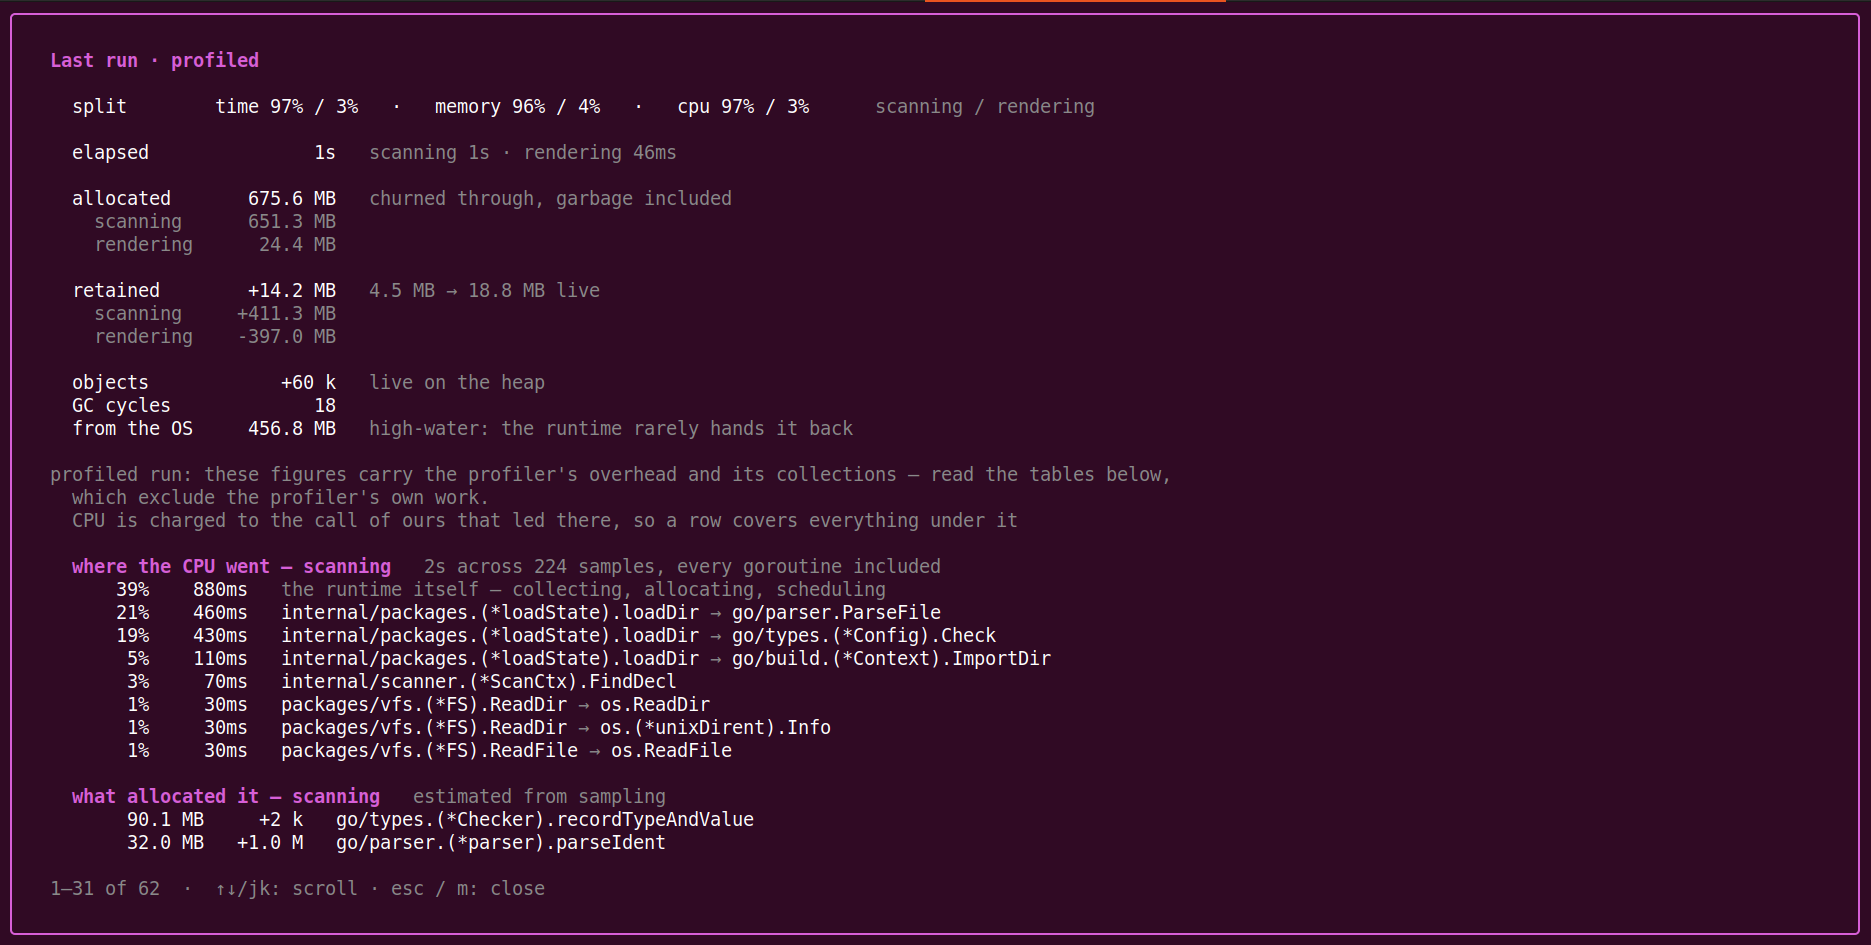
CPU is charged to the call of ours that led there, not to the leaf frame. A leaf answers “what was executing”, which for this program is mostly the allocator and the collector — true, and nothing anyone can act on. Charged our way, a row names the boundary where codescan hands the work to somebody else’s code, and covers everything under it.
Profiling is not free, and the card says so rather than letting you compare
across runs by accident: under -profile the scalars at the top carry the
profiler’s own overhead and its collections, while the tables below exclude
them. The card scrolls when it outgrows the terminal (↑↓/jk, PgUp/PgDn,
Home/End).
It names the .pprof files it wrote and the go tool pprof commands that open
them. All three flags are addressed in the profile section of a
.codescan.yaml.
Looking up an annotation
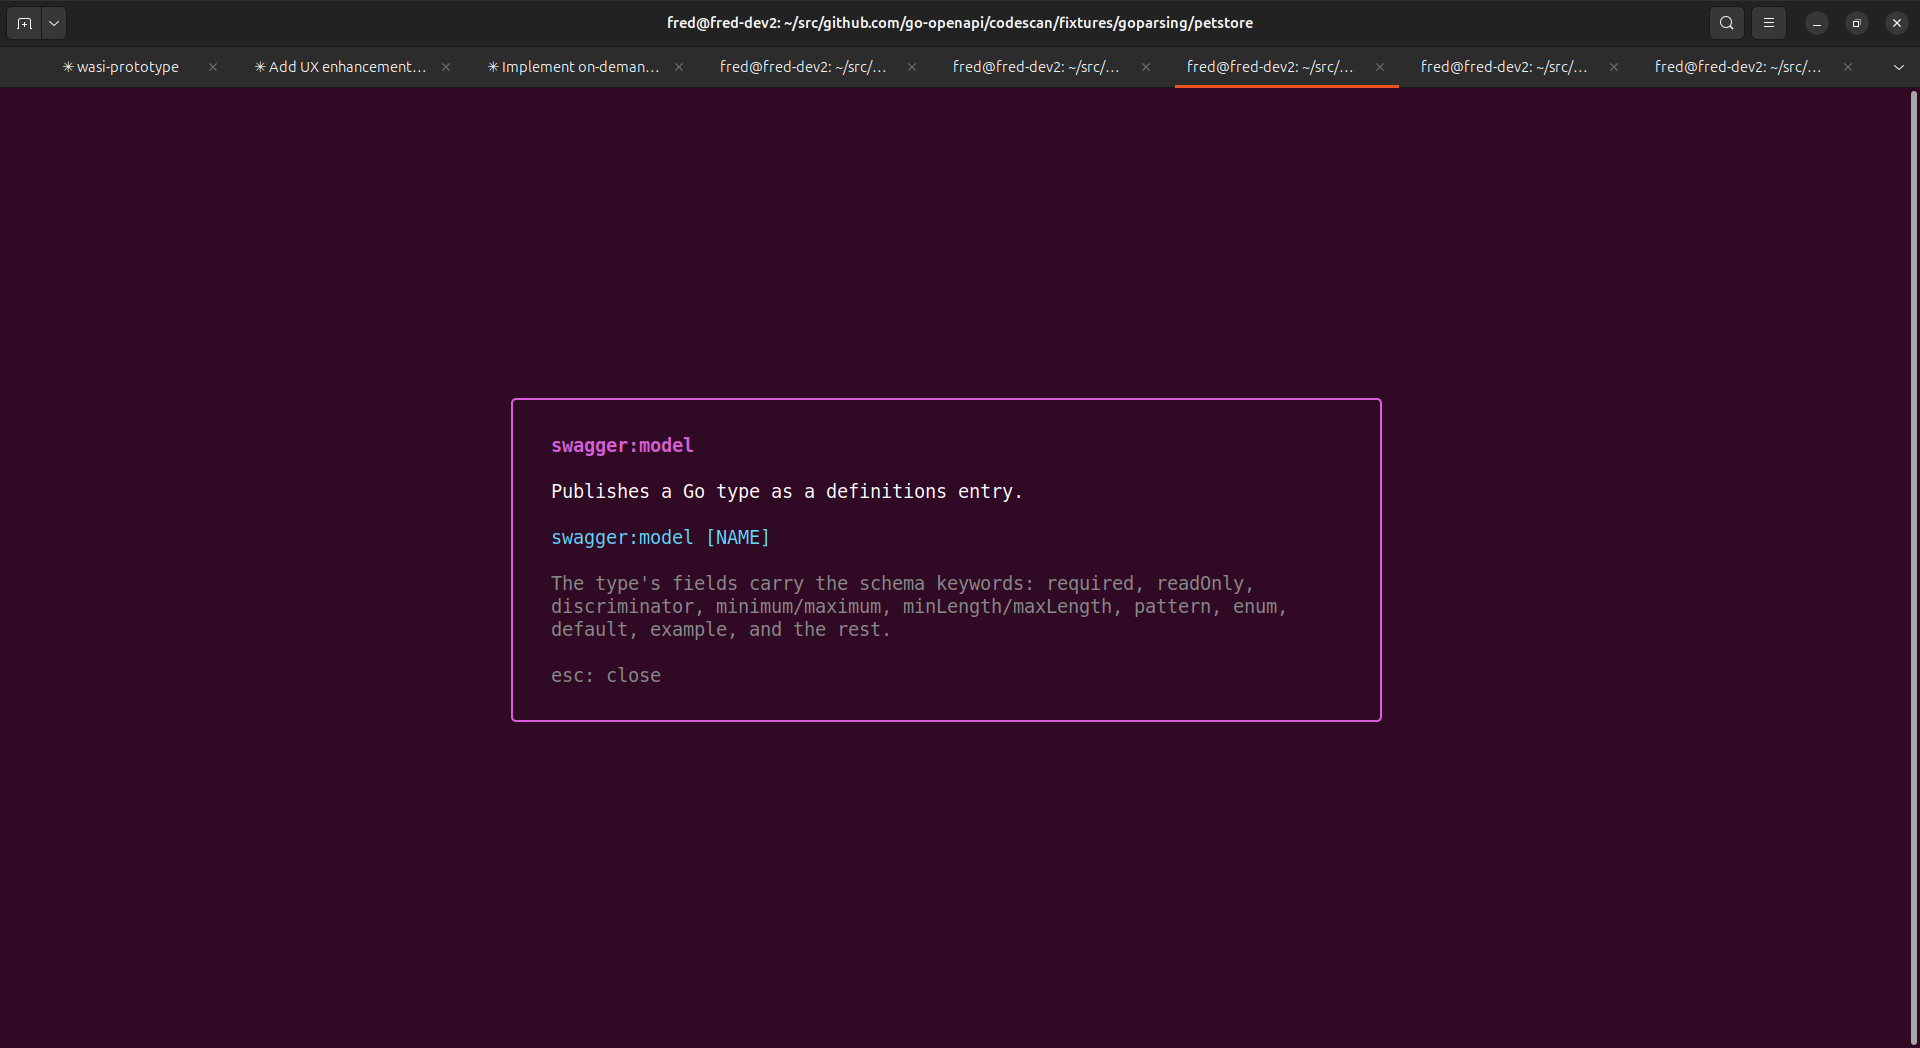
With the viewer’s navigation line on a comment carrying a swagger: directive,
K shows what that annotation does: its syntax, a one-line summary, and what may
be written in its body. Clicking the directive does the same.
K because it is vim’s “look up what is under the cursor”, and what LSP clients
bind hover to. It reads the buffer, so it works on an annotation you are
still typing — which is when you want it.
The popup covers all twenty swagger: annotations, and each entry names the
family of keywords its body accepts rather than listing them: there are far too
many individual keywords for a popup to be the right place for them. For those,
and for worked examples of every annotation, the reference on this site is the
long form:
- Annotations — one page per annotation, with grammar and live examples
- Keyword reference — every keyword, grouped by the family it belongs to
Keys worth knowing
The binding surface is context-dependent — f follows from three different
panes, Enter opens a file in the tree but follows a $ref in the spec — so the
header carries a standing h: help banner.
| Key | Action |
|---|---|
h / ? | the full keymap, grouped by pane |
Tab / click | focus a pane (the wheel scrolls whichever pane is under the pointer) |
ctrl+arrows | move either divider, in the arrow’s own direction |
f | follow mode |
K | what the swagger: annotation on this line means |
v / V | validate the spec / switch diagnostics tab |
o | scanner options |
m | what the last scan cost |
r / F5 | rescan now / re-read the open file from disk |
c | copy the focused pane to the clipboard |
ctrl+q | quit |
Everything else — the per-pane bindings, the editor, the popups — is in the h
overlay and in the
module README,
which documents the internals as well.
Worth knowing before you rely on it
These limits are deliberate; the TUI reports them rather than guessing.
The editor rewrites whitespace on save
bubbles/textarea expands tabs to four spaces when a file is loaded and treats a
lone CR as a line break, and neither has an exported knob. Everything the TUI
shows you agrees with itself because it all reads the same normalised text — but
Ctrl-S writes the buffer, so saving re-indents a tab-indented file with
spaces and rewrites CRLF endings as LF. Edit and save here only when you are
content with that; otherwise edit in your own editor and let the watcher pick the
change up.
- Not every node has source. codescan anchors code-detail nodes — type
declarations, fields, values, route and meta blocks — and finer nodes resolve to
their nearest anchored ancestor. A node with no anchored ancestor at all was not
produced from code (an
InputSpecoverlay node, say); the follower holds position and says so instead of jumping somewhere plausible. - Positions are as of the last scan. With unsaved edits in the buffer every
anchor below the edit has shifted, so follow shows a
STALEbadge. Saving triggers a rescan and clears it. $refresolution is a site index, not a resolver. Local#/…refs are followable; a ref into another file or a URL is reported as external rather than chased.- Some keys are terminal-dependent.
shift+F3andctrl+arrow rely on sequences most modern emulators send and a few (notably inside a defaulttmux) do not. Where they are missing nothing misfires — there is simply no previous-reference key, and no resize keys. - Split sizes last for the session only. They survive rescans and terminal
resizes, but not a restart. The TUI does read a
.codescan.yaml— but what a file can set is flags, and where the splits sit is not one of them.
The module README carries the full list.
What’s next
- Usage as a library — drive the same
scanner from your own program, a
go:generatestep, or a test. - Usage as a headless CLI — the same scan in a build, with the settings you converged on here.
- Options reference — every knob the
opopup toggles, and what it does to the document. - Tutorials — annotate a package from meta to definitions, with the TUI open beside you.